| Ratio | Value | Comment (EN) |
|---|---|---|
| Net Profit Margin | 20.92% | Strong net margin |
| EBIT Margin | 25.73% | Very healthy operational margin |
| Gross Profit Margin | 29.93% | Good product margins |
| Value Added / Sales | 27.21% | Strong internal value creation |
| Personnel Costs / Sales | 1.32% | Very lean operation |
| Operating Costs / Sales | 73.89% | Well-managed costs |
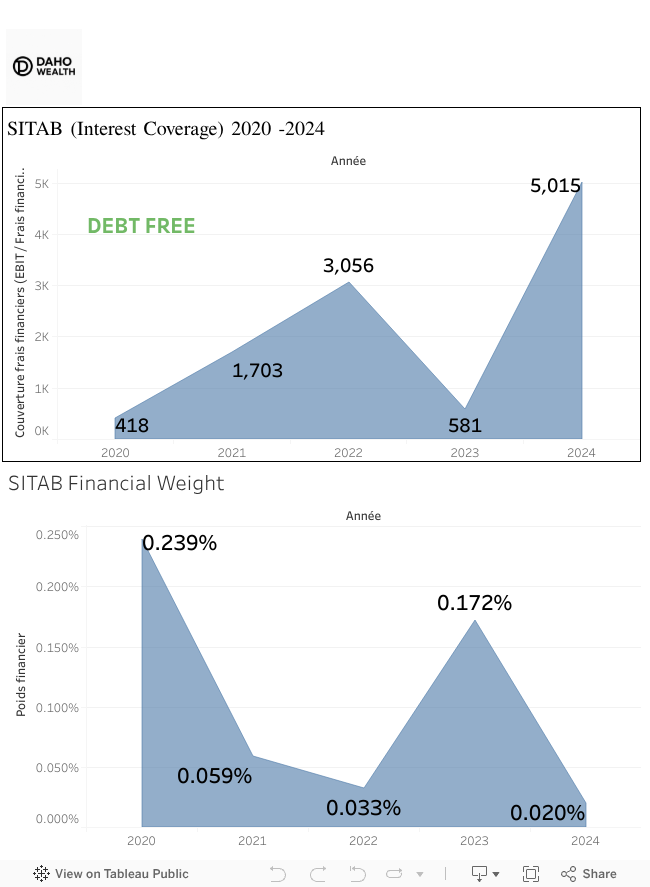
| Interest Coverage | 5,015x | Excellent solvency (debt-free) |
| Financial Weight | 0.02% | Negligible interest burden |
| Break-even Revenue | 35.88B CFA | Break-even far below revenue |
SITAB Financial Analysis 2020–2024
Profitability, Growth, and Debt Profile
📊 2024 Snapshot of Financial Ratios
This section presents a snapshot of SITAB’s 2024 performance using key financial ratios such as profitability, cost control, solvency, and operational efficiency.
📈 Income Statement Growth Table (2020–2024)
The following table shows year-over-year changes in revenue, EBIT, and net income. These metrics highlight the company’s ability to grow profitably and control expenses over time.
| Year | Sales Variation | Operating Income EBIT | Net Income YOY | EBIT Operating Profit | Value Added | Financial Expenses | Personnel Costs | Net Profit Margin | EBIT Margin | Value Added to Revenue | Personnel Costs to Revenue | Interest Coverage Ratio | Financial Weight |
|---|---|---|---|---|---|---|---|---|---|---|---|---|---|
| 2021 | 16.8% | 102.4% | 11.2% | 102.4% | 75.4% | -50.3% | -5.3% | -4.8% | 73.3% | 50.2% | -18.9% | 307.2% | -75.4% |
| 2022 | 11.5% | 36.0% | 21.1% | 36.0% | 28.3% | -24.2% | 6.2% | 8.6% | 22.0% | 15.0% | -4.8% | 79.4% | -44.3% |
| 2023 | 12.5% | 27.3% | 7.8% | 27.3% | 27.6% | 570.1% | 21.8% | -4.2% | 13.2% | 13.4% | 8.3% | -81.0% | 426.3% |
| 2024 | 26.2% | 238.3% | 260.8% | 238.3% | 196.8% | -60.8% | -5.8% | 185.8% | 168.1% | 135.1% | -25.4% | 763.6% | -88.4% |
💰 SITAB | Yearly Financials 2020–2024
This table displays the actual figures for sales, net income, EBIT, and financial ratios. Percentage columns are interpreted relative to total revenue.
| Year | CA (Ventes) / Sales | Resultat D'exploitation / Operating Income | Résultat Net / Net Income | EBIT / Operating Profit | Valeur Ajoutee/ Value Added | Finance Charge | Labor | Net Margin | EBIT margin | Valeur Ajoutée / CA | Charges Personnel / CA | Couverture frais financiers (EBIT / charges finance) | Financial Weight (poids) |
|---|---|---|---|---|---|---|---|---|---|---|---|---|---|
| 2024 | 213794216965 | 55005589361 | 44730358142 | 55005589361 | 58179993821 | 10968371 | 2821075854 | 20.922155 | 25.728287 | 27.213081 | 1.319529 | 5014.928 | 0.0001994 |
| 2023 | 169386596154 | 16258209527 | 12399004223 | 16258209527 | 19604848526 | 27999272 | 2995879455 | 7.319944 | 9.598286 | 11.574026 | 1.768664 | 580.670 | 0.0017222 |
| 2022 | 150593180425 | 12768812060 | 11503188097 | 12768812060 | 15366441597 | 4178492 | 2459217465 | 7.638585 | 8.479011 | 10.203943 | 1.633020 | 3055.840 | 0.0003272 |
| 2021 | 135071753727 | 9388373157 | 9499192306 | 9388373157 | 11980299113 | 5512989 | 2316042385 | 7.032701 | 6.950656 | 8.869581 | 1.714676 | 1702.960 | 0.0005872 |
| 2020 | 115654649538 | 4638985646 | 8542921197 | 4638985646 | 6831571107 | 11091748 | 2446116167 | 7.386578 | 4.011067 | 5.906871 | 2.115018 | 418.240 | 0.0023910 |
📈 Sales and Net Income Evolution (2020–2024)
This dashboard shows how SITAB’s revenue and profitability evolved year-over-year. The 2024 spike is particularly notable.

💹 Net Margin
The net profit margin rose dramatically in 2024, reaching 21%, which means for every 1,000 FCFA of sales, SITAB retains 210 FCFA as net profit.

🛡️ SITAB Financial Leverage and Debt Position
This dashboard confirms that SITAB is essentially debt-free. The company’s EBIT is more than sufficient to cover any minor financial costs.
🧠 Conclusion
SITAB has demonstrated excellent financial performance between 2020 and 2024, particularly in 2024 where profitability metrics spiked significantly. The firm has low financial risk, strong internal value generation, and operates with a lean cost structure.